IC Markets Home Sign in Web Trader Contáctanos
IC Markets Social IC Markets Social

Información para
Operadores Serios

  • Acerca de IC Markets
  • ABRA UNA CUENTA BURSÁTIL
  • PRUEBE UNA DEMO GRATIS
  • Comienza a Operar
  • VISIT OUR BLOG
IC Markets Social
  • Acerca de IC Markets
  • ABRA UNA CUENTA BURSÁTIL
  • PRUEBE UNA DEMO GRATIS
  • Comienza a Operar
  • VISIT OUR BLOG
March 17, 2022North_American_Stocks_ptIC Markets

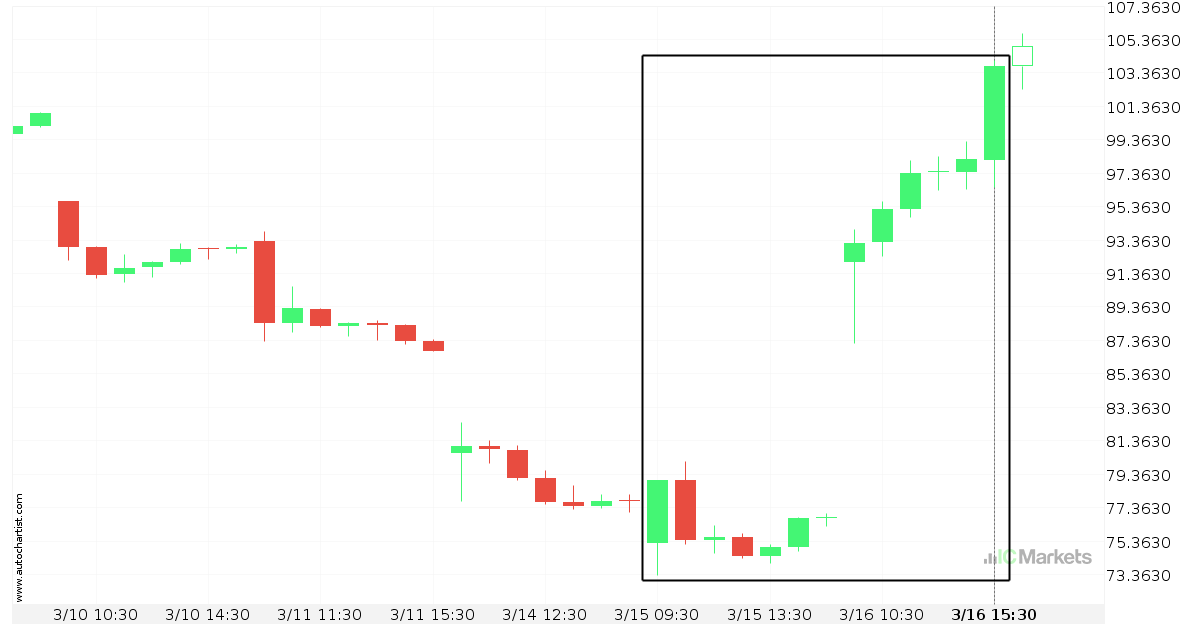
What’s going on with Alibaba Group Holding Limited?

Those of you that are trend followers are probably eagerly watching Alibaba Group Holding Limited to see if its latest 31,38% move continues. If not, the mean-reversion people out there will be delighted with this exceptionally large 2 days move.

Read more
March 16, 2022North_American_Stocks_ptIC Markets

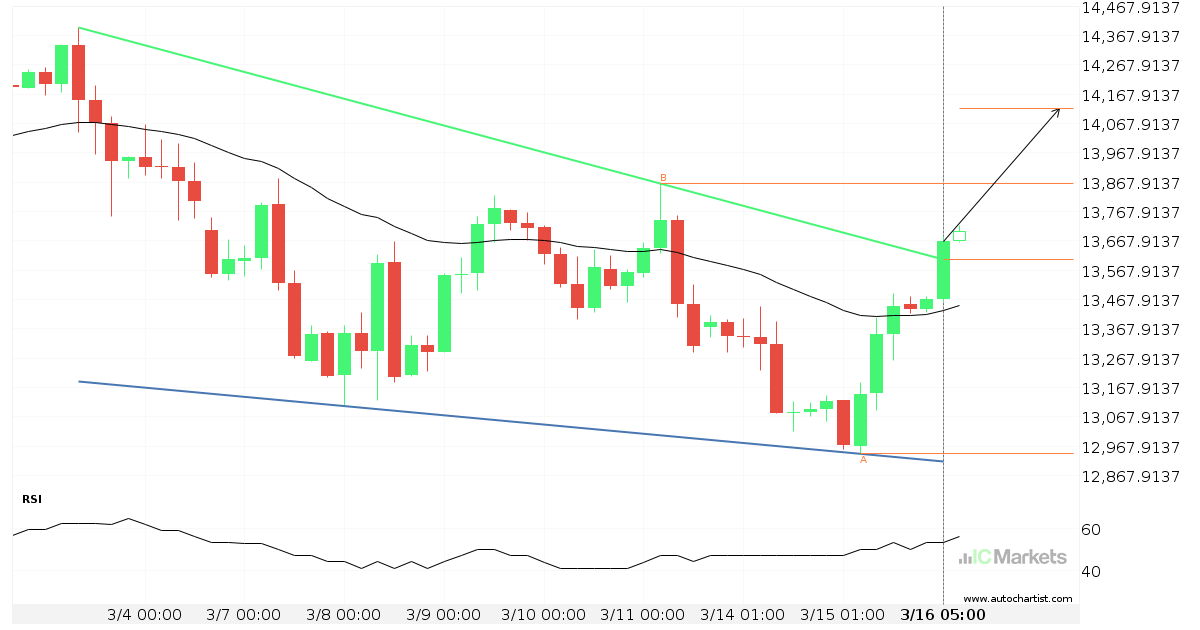
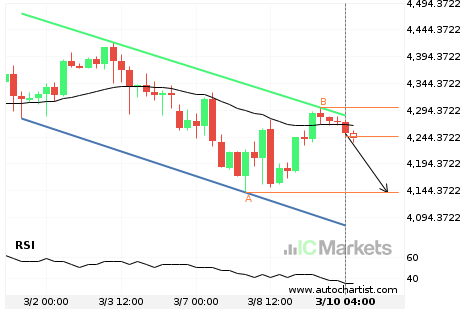
US Tech 100 Index – resistance line breached

US Tech 100 Index has broken through the resistance line of a Cunha descendente technical chart pattern. Because we have seen it retrace from this line in the past, one should wait for confirmation of the breakout before taking any action. It has touched this line twice in the last 13 days and suggests a […]

Read more
March 15, 2022North_American_Stocks_ptIC Markets

Will US Wall Street 30 Index have enough momentum to break resistance?

US Wall Street 30 Index is heading towards the resistance line of a Cunha descendente and could reach this point within the next 17 hours. It has tested this line numerous times in the past, and this time could be no different from the past, ending in a rebound instead of a breakout. If the […]

Read more
March 14, 2022North_American_Stocks_ptIC Markets

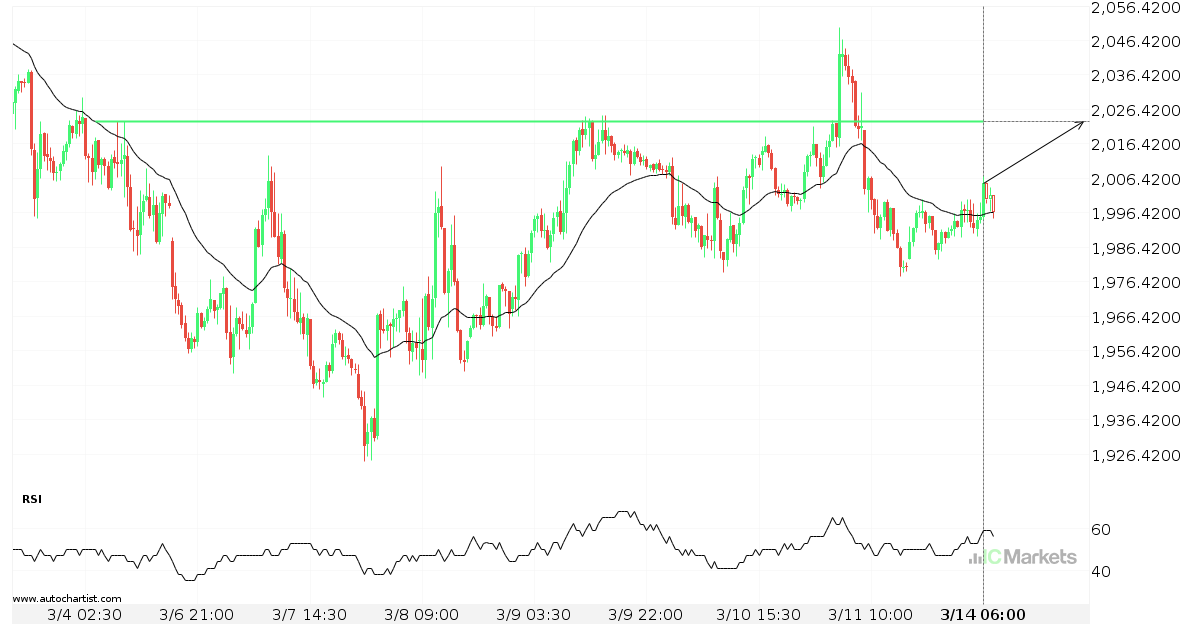
Should we expect a breakout or a rebound on US Small Cap 2000 Index?

The movement of US Small Cap 2000 Index towards 2022.9301 price line is yet another test of the line it reached numerous times in the past. We could expect this test to happen in the next 2 days, but it is uncertain whether it will result in a breakout through this line, or simply rebound […]

Read more
March 11, 2022North_American_Stocks_ptIC Markets

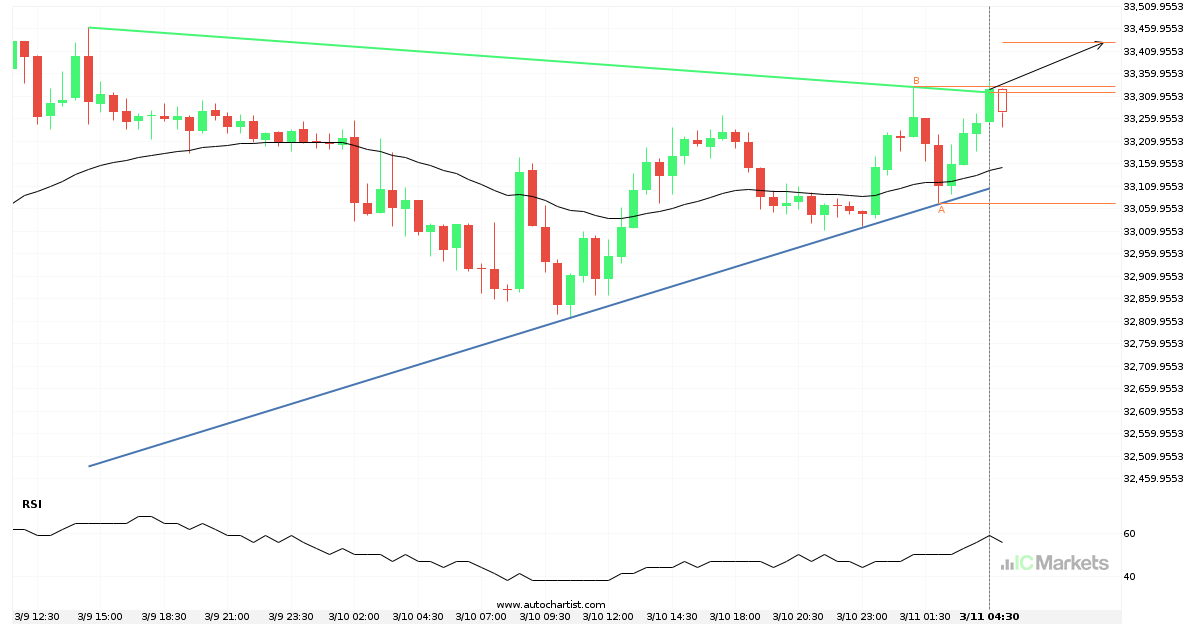
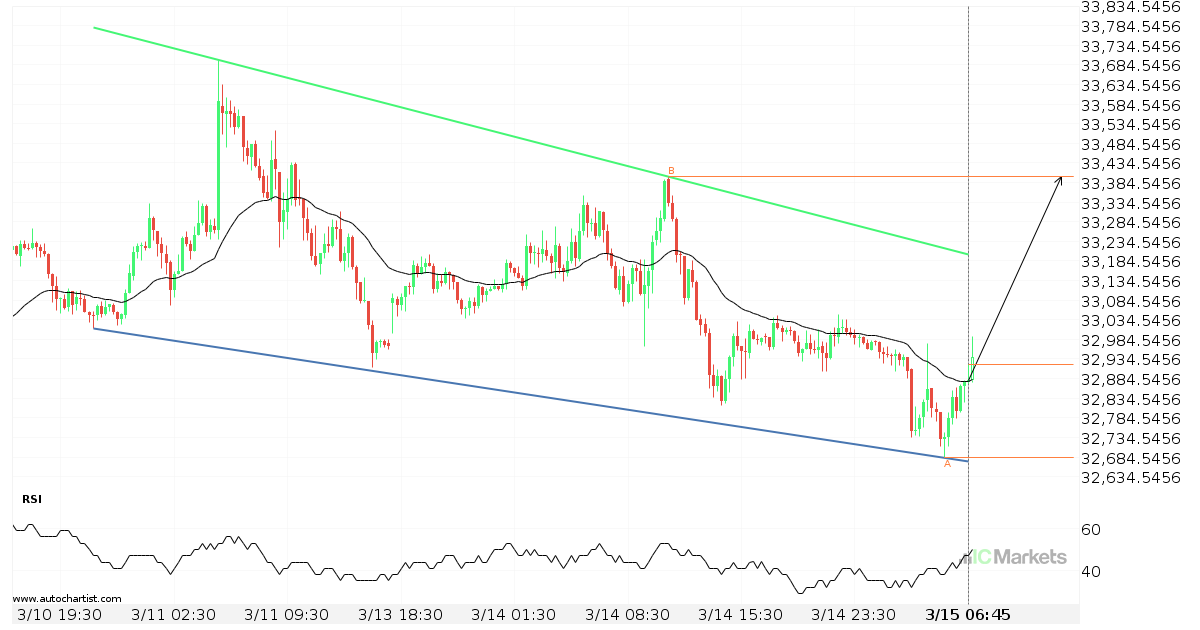
US Wall Street 30 Index has broken through resistance

US Wall Street 30 Index has broken through a resistance line. It has touched this line at least twice in the last 2 days. This breakout may indicate a potential move to 33429.8540 within the next 11 hours. Because we have seen it retrace from this position in the past, one should wait for confirmation […]

Read more
March 10, 2022North_American_Stocks_ptIC Markets

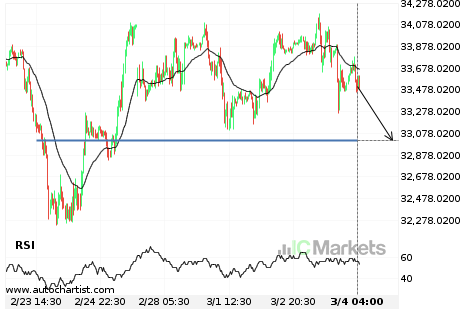
US SPX 500 Index approaching support of a Canal descendente

US SPX 500 Index is approaching the support line of a Canal descendente. It has touched this line numerous times in the last 9 days. If it tests this line again, it should do so in the next 2 days.

Read more
March 9, 2022North_American_Stocks_ptIC Markets

Either a rebound or a breakout imminent on US Small Cap 2000 Index

US Small Cap 2000 Index is heading towards the support line of a Canal descendente. If this movement continues, the price of US Small Cap 2000 Index could test 1924.3300 within the next 2 days. It has tested this line numerous times in the past, so this movement could be short-lived and end up rebounding […]

Read more
March 8, 2022North_American_Stocks_ptIC Markets

US Small Cap 2000 Index – getting close to resistance of a Cunha descendente

US Small Cap 2000 Index is moving towards a resistance line. Because we have seen it retrace from this line before, we could see either a break through this line, or a rebound back to current levels. It has touched this line numerous times in the last 7 days and may test it again within […]

Read more
March 4, 2022North_American_Stocks_ptIC Markets

A final push possible on US Wall Street 30 Index

US Wall Street 30 Index is heading towards 33016.3984 and could reach this point within the next 2 days. It has tested this line numerous times in the past, and this time could be no different, ending in a rebound instead of a breakout. If the breakout doesn’t happen, we could see a retracement back […]

Read more
March 3, 2022North_American_Stocks_ptIC Markets

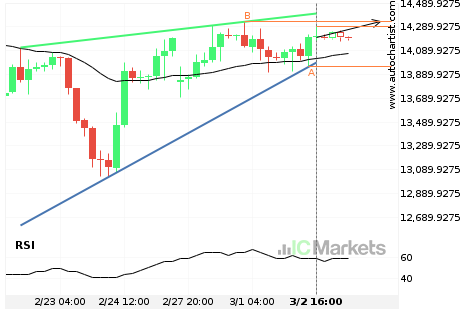
Either a rebound or a breakout imminent on US Tech 100 Index

US Tech 100 Index is heading towards the resistance line of a Cunha ascendente. If this movement continues, the price of US Tech 100 Index could test 14331.9000 within the next 2 days. It has tested this line numerous times in the past, so this movement could be short-lived and end up rebounding just like […]

Read more
  • 1
  • 2
  • 3
  • …
  • 60
  • 61
  • 62
  • 63
  • 64
  • 65
  • 66
  • …
  • 87
  • 88
  • 89

Recent Posts

  • Brent Oil vs US Dollar – نموذج الرسم البياني – قناة صاعدة
  • Brent Oil vs US Dollar – نموذج الرسم البياني – قناة صاعدة
  • Hong Kong 50 Index – نموذج الرسم البياني – مثلث صاعد
  • Hong Kong 50 Index – รูปแบบกราฟ – สามเหลี่ยมขาขึ้น
  • Hong Kong 50 Index – نموذج الرسم البياني – مثلث صاعد

Recent Comments

    Traducción


     Edit Translation

    Opere con un

    líder del mercado en el que puede confiar

    ABRA UNA CUENTA BURSÁTIL PRUEBE UNA DEMO GRATIS

    Trading en Forex

    • Qué es Raw Spread
    • Resumen de cuentas
    • Abre una Cuenta
    • Trader Launch en Web

    Especificaciones de Trading

    • Spreads y Comisiones
    • Rango de Mercados
    • Horas de Trading
    • Depósitos
    • Retiros

    Acerca de IC Markets

    • Help Center
    • Por qué con IC Markets
    • Regulación
    • Documentos Legales
    • Contáctanos


    Forex Trading

    • Accounts Overview
    • Open an Account
    • Launch Web Trader

    Trading Specifications

    • Spreads and Commissions
    • Range of Market
    • Trading Hours
    • Funding
    • Withdrawal

    About IC Markets

    • Chat with a Specialist 24/7
    • Why IC Markets
    • Regulation
    • Legal Documents
    • Contáctanos

    Descargo de responsabilidad: Estos documentos son material de marketing cuyo contenido es publicado solo con propósitos informativos. Este material no contiene y no debe ser considerado un consejo de inversión y recomendaciones, o sugerencias para llevar a cabo otras acciones con los instrumentos financieros. Los widgets integrados pertenecen a sus autores independientes externo, y IC Markets no es responsable de su contenido o cómo afectan en las operaciones.

    Derechos reservados de todo el contenido. Las opiniones de los autores tal vez no coincidan con la opinión de los editores del blog. Cuando copie material de este sitio o conecte RSS para volver a publicar nuestros artículos, es obligatorio el enlace a IC Markets o la atribución en el formato “Blog de IC Market”. Para dudas generales, por favor, póngase en contacto con la oficina editorial a través de la página “Contacto”.

    Advertencia de riesgo: Operar derivados conlleva un altor riesgo en su capital y solo debería operar con capital que puede permitirse perder. Las operaciones con derivados podrían no ser adecuadas para todos los inversores, por lo tanto, asegúrese de entender por completo los riesgos que conlleva y buscar asesoramiento independiente si fuera necesario. Una Declaración de Divulgación del Producto (PDS, por sus siglas en inglés) se tendrá en cuenta antes de participar en una transacción con nosotros.

    Los contenidos de esta página son solo información general y no tienen en cuenta su situación personal, objetivos financieros o necesidades. Depende de usted garantizar que los productos que ofrecemos se ajustas a sus necesidades específicas. No debería operar con nosotros a menos que entienda las características y riesgos de los productos que ofrecemos. Esto significa que tal vez necesite buscar asesoramiento independiente antes de empezar a operar con nosotros.

    © 2022 Raw Trading Ltd | All rights reserved.
    • Sample Page